Estimates are based on smartphone data and precinct-level 2016 vote results
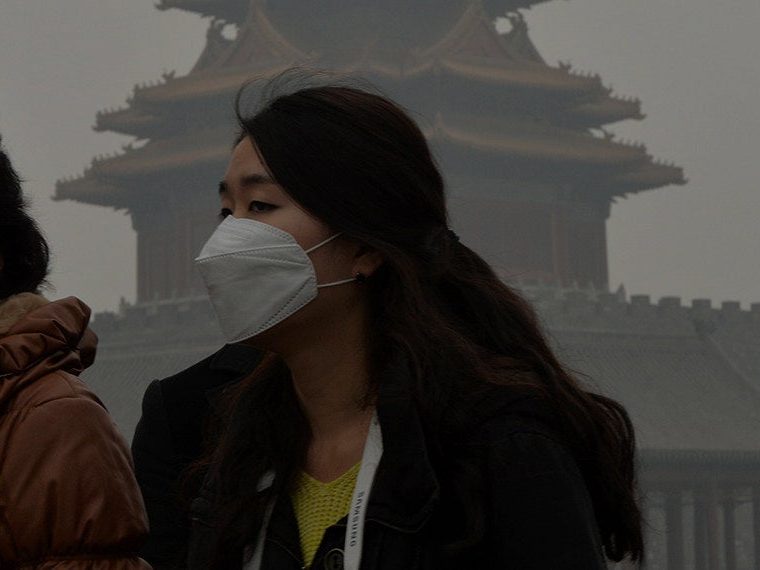
How the U.S. should react to the coronavirus has become more of a partisan issue with each passing day, represented by masked-up Democrats who urge caution in reopening the economy and naked-faced Republicans who demonstrate, often in close quarters to one another, against the lockdown.
Those are the images chosen for television news and newspaper front pages, anyway. But measuring how millions of individual Americans are actually complying, or not, with stay-at-home orders and other virus-control measures is considerably more difficult. As is gauging how that behavior might be contributing to the spread of the virus.
It’s especially so because the virus has been far more prevalent in states that vote heavily Democrat, notably New York. It would be natural for New Yorkers to exercise more caution. The state has been the scene of more than 350,000 diagnosed cases of the virus and more than 28,000 resulting deaths. Texas, a Republican stronghold, has seen roughly one-seventh the cases of New York, or roughly 50,000, and suffered about 1,400 deaths.
Opt In to the Review Monthly Email Update.
Is the conservative Texan rashly thumbing his nose at stay-at-home orders, or is he merely reacting reasonably to what locally has been a less ominous threat? Is the liberal New Yorker a rule-abiding do-gooder, or merely scared out of his wits?

Total confirmed COVID-19 cases among all U.S. counties as of April 30, 2020. Source: Chen et al. (2020), Causal Estimation of Stay-at-Home Orders on SARS-CoV-2 Transmission (supplementary materials)
A team of UCLA Anderson researchers set out to discern behavior around the virus, looking to neutralize those local and regional differences in their analysis, and to isolate how political allegiance affects behavior. To measure reaction to the virus before lockdown orders, and compliance once those orders were put in place, they used voting data for the 2016 U.S. presidential election (Trump vs. Clinton) from the nation’s 172,000 precincts, the most detailed available, and smartphone geographic movement data for 10 million Americans.
The researchers — UCLA Anderson faculty M. Keith Chen and Elisa F. Long, Ph.D. students Yilin Zhuo and Malena de la Fuente, and postdoctoral research fellow Ryne Rohla — represent one of many research teams and journalism organizations trying to answer these questions. Chen has used smartphone data to uncover partisan behavior in previous studies, and Long has used epidemiological modeling to track and forecast Ebola outbreaks.
Among the authors’ findings:
- Millions of Americans voluntarily limited their movements, often locking down days or weeks before government orders codified restrictions. By April 30, when nine out of 10 Americans were under stay-at-home orders, average daily roaming distance measured by smartphones had fallen 70% from the days before coronavirus made headlines.
- After local stay-at-home orders were enacted, likely Trump supporters reduced movement by 9%. Likely Clinton voters under the same orders and risks reduced movement by 21%.
- Limiting movement, whether voluntarily or by order, decreased the virus transmission rate by 49%. (Transmission rate, considered a key indicator of containment, represents the number of people one virus carrier will infect.) But official stay-at-home orders accounted for only a 7% decline in transmission rate, with most of the decline attributable to reduced movement stemming from voluntary changes.
- Within counties, the effective reproduction number, or average number of people each virus carrier will ultimately infect (assuming not everyone the carrier contacts will get it), is estimated at 1.32 for likely Trump voters and 1.14 for likely Clinton voters. That’s because likely Trump voters moved about more.
To identify individuals as likely Trump or Clinton voters, the researchers looked at where individuals (and their smartphones) spent their nights in the run-up to the pandemic. Making the assumption that this is home, they matched the location to a 2016 voting precinct. If the precinct voted 80% Trump and 20% Clinton, they inferred that the individual attached to that smartphone had an 80% chance of voting for Trump.
To understand how this behavior affects the spread of coronavirus, they used an epidemiological model that looks at movement changes across U.S. counties. “Democrat-leaning counties account for the overwhelming majority of COVID cases, at all phases of the epidemic,” the authors note. “Analyzing movement behavior at the individual level mitigates this potential confound, by restricting comparisons to Trump and Clinton voters who reside in nearby precincts within the same county — and thus face similar exposure risks, local mandates and political leaders.”
The findings have implications for policymakers as they lift stay-at-home restrictions or consider reinstating them in the future. Without accounting for trends in daily movement, the authors note, one might attribute a drop in new coronavirus cases directly to government-imposed movement restrictions. The study suggests that the mandates play a more modest role in containment, and citizens’ personal choices about behavior a bigger role.
“People reduced movement as the pandemic worsened,” the authors write, “driven (presumably) by the severity of the crisis, measurably filtered through a partisan lens.”
Featured Faculty
-
M. Keith Chen
Professor of Economics
-
Elisa Long
Associate Professor of Decisions, Operations, and Technology Management
About the Research
Chen, M.K., Zhuo, Y., de la Fuenta, M., Rohla, R., & Long, E.F. (2020). Causal estimation of stay-at-home orders on SARS-CoV-2 transmission.


